A Gauge for the Financial Bellwether’s This Week
July 13, 2015"Any jerk can have short-term earnings. You squeeze, squeeze, squeeze, and the company sinks five years later."
-Jack Welch
Corporate earnings season is upon us once again (the summer version tends to come more quickly than most, although there is no deep science to back this up). This is an important week on the calendar with some big bellwethers like JP Morgan Chase, Goldman, Sachs & Co. and Blackrock reporting for Financials, and Google and Intel for the Tech Sector.
Investors of these stocks have been evaluating their positions going into the prints this week. Based on their forecasts for the quarter and street expectations, most come to a determination on whether they are in good shape, or maybe too big from a risk management perspective or too small from an opportunity perspective. Others might be viewing this week as a shorter term trading opportunity.
EidoSearch makes these decisions more profitable. We look at the trading patterns of these stocks going into the earnings event, and look for similar patterns in a peer group that were going into earnings historically to get the range of probable outcomes. There’s information contained in the patterns that effects the size of moves post release, and is valuable information that investors can incorporate in their process going into and coming out of the announcement.
For example, let’s say you feel that the company will outperform in the quarter vs. expectations. You like the long term fundamentals and want to use this opportunity to size up your position heading into earnings. Would it be nice to know what the possible downside is if you’re wrong? What about if you’re right, what is the typical move and what are the range of probable moves? We provide the objective gauge for this decision, no matter how good or bad the results are, to better understand where the stock is likely to move and help with risk/reward.
We ran analysis comparing hundreds of millions of patterns to see which of the bigger Financials reporting this week had positive ranges or skews, and which had the most negative.
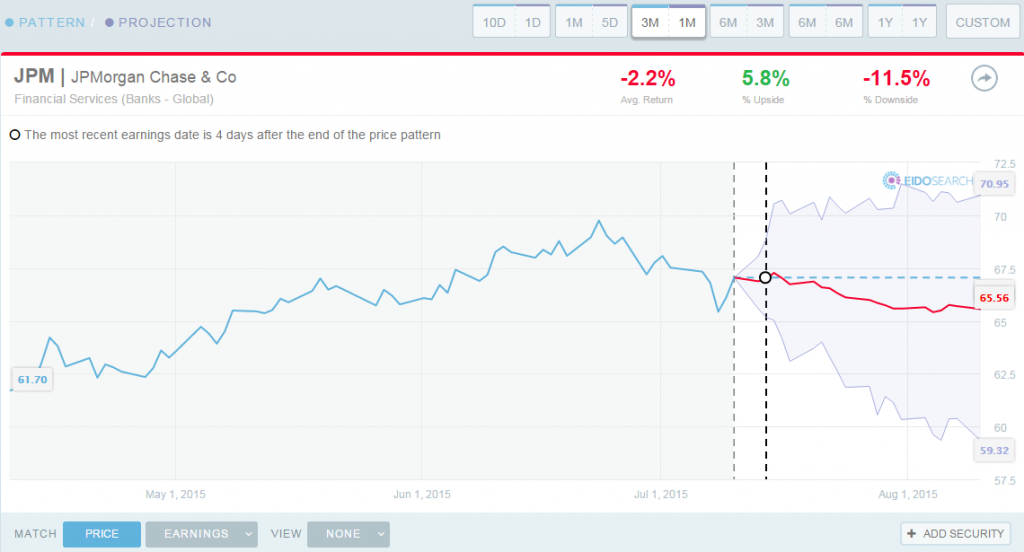
The first is JPMorgan Chase (JPM) which has the most negative projection of the big Financial stocks reporting over the next couple of weeks. They had a good quarter, but you can see per the chart below that the stock is off since the end of June. When peer Financial stocks have traded like this a day before earnings historically…..
- The stock is down 55.2% of the time
- The average return in the next 1 month is -2.2%
- There is 85% probability the stock will be below a 5.8% gain in the next 1 month
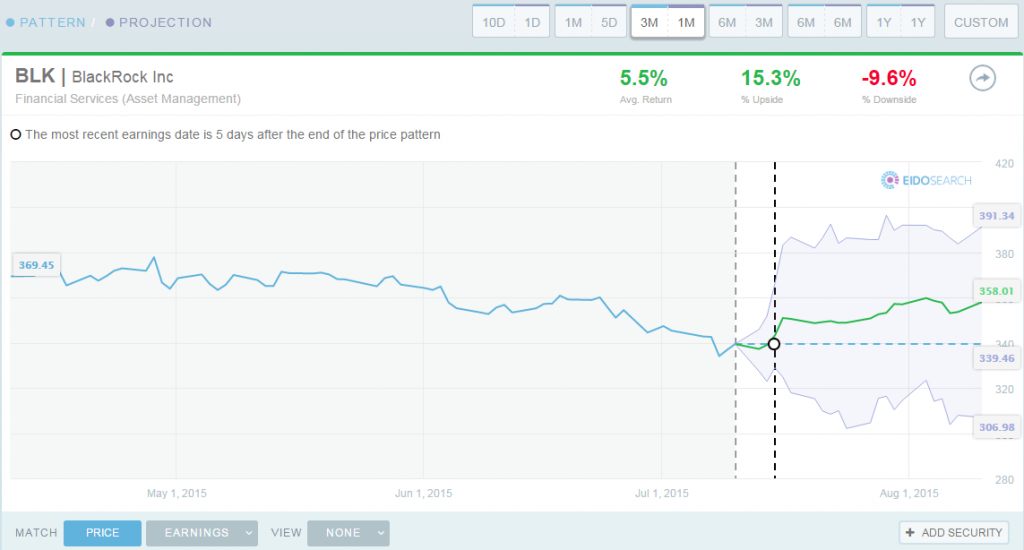
Blackrock (BLK) has the most positive range of probable outcomes. Per the chart below, you can see the downward trajectory of the stock for the quarter, but a settling over the past week. When peer Financial stocks have traded like this two days before earnings historically…..
- The stock is up 66.3% of the time
- The average return in the next 1 month is 5.5%
- There is 1.6x the upside to downside in the next 1 month

Have a great week!

