Gold is Going Down
September 28, 2015"We’re going to Hell, so bring your sunblock."
-Ari Gold, Entourage
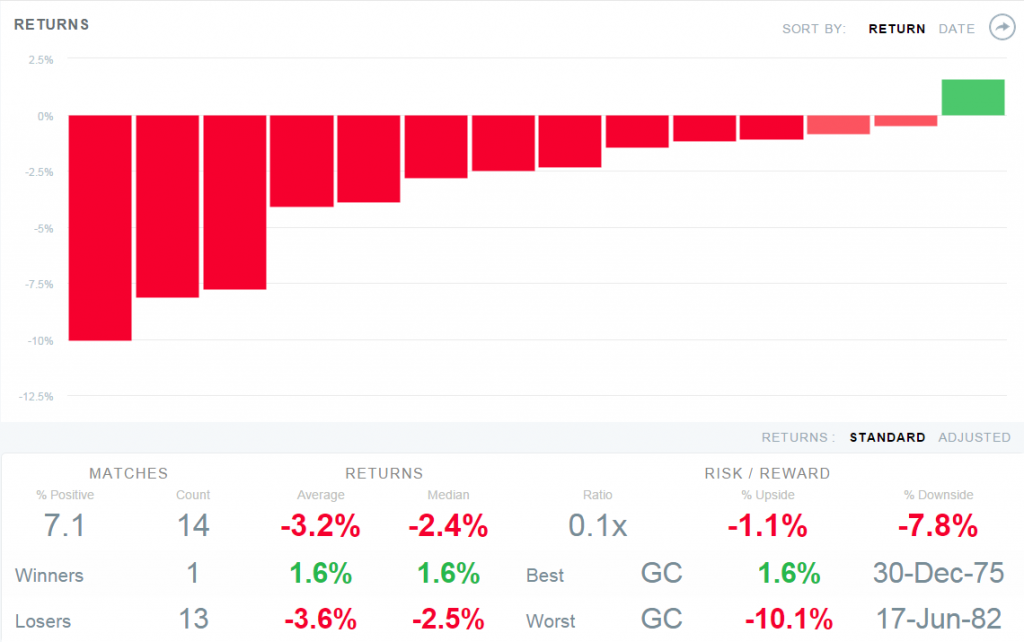
For those of you excited about Gold’s move up over the past week and the Fed’s continued concerns on global economic growth, we offer a sobering fact: In 13 similar trading environments in the last 40 years, Gold has never been up in the next one month.
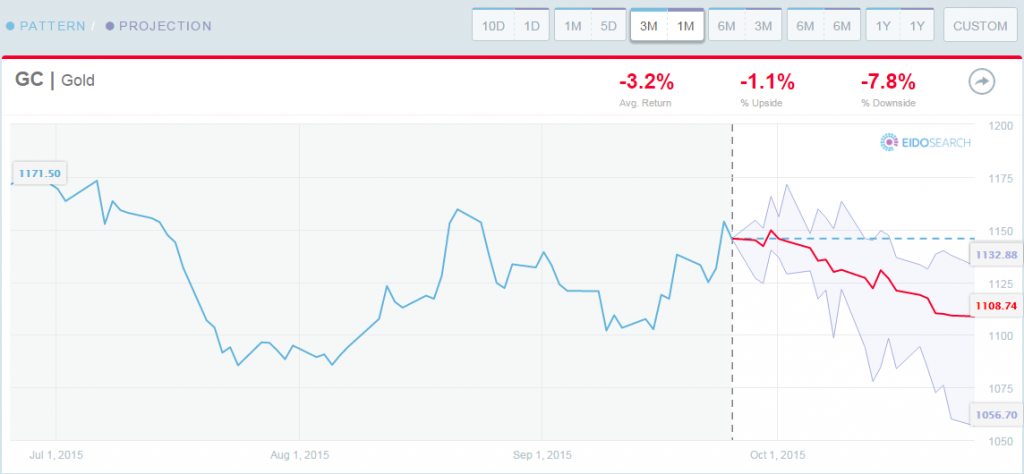
EidoSearch analyzed the last 90 day trading pattern for Gold. We found 14 statistically similar instances in all, and the only match that is up in the next one month is an increase of 1.6% way back in 1975. The projection chart below shows the current 90 day price trend, and the forward projection statistics.
Average drop in the next 1 month of -3.2%
The expanded statistics below plot the following one month returns of the matches. You’ll see a few instances that are off substantially, including a -10.1% drop in 1982 and three that are down more than -7.5%.
If you are interested in the time periods for the 14 analogs, just email us at info@eidosearch.com and we’ll send you the table.
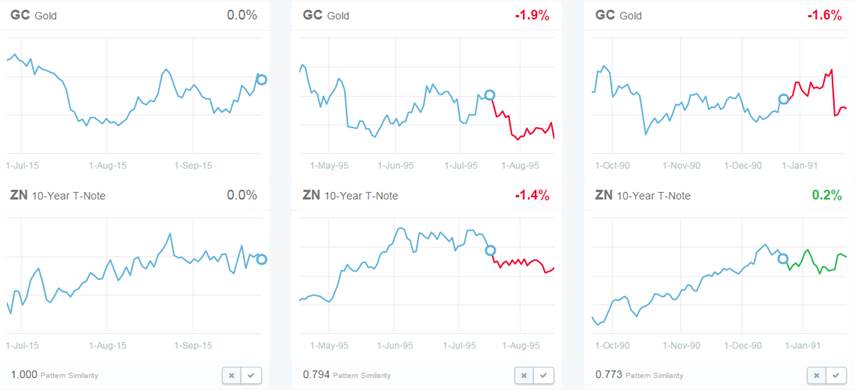
We did one final piece of analysis, looking at the 90 day patterns for both Gold and the 10-year Treasury, to see if there are any similar matches historically to today.
We found only four of them, and Gold is down in three of the four with the only instance rising in the next one month being a meek 1.4% in 1986. Here are the two most similar matches from 1995 and 1990.
Have a great week!


