The Future of Yahoo!?
March 14, 2016"The path to success is never linear, right?"
-Marissa Mayer, Yahoo CEO
Marissa Mayer’s defense of Yahoo!’s track record: non-linearity.
That might not resonate with shareholders in a proxy-fight, but if you look at pretty much any stock data, you’d see Marissa is absolutely correct. Stock valuations are event-driven, complex, hard-to-model…non-linear systems.
How else would you expect valuations to behave? If you’ve ever run a business, and occasionally look back at your successes and failures, it’s striking how fortunes change in unexpected ways. And that’s looking back. Imagine wrapping your mind around the many yet-to-be realized nonlinear paths looking forward. To distinguish these often conflated concepts, we’re introducing a new symbol: when talking about the future, we append “?” to the company name, in this case Yahoo!?
Yahoo!? has the pending actions of 40 bidders lining up to explore a purchase of the core business, a new three-year strategic plan and, who knows what else, maybe a big, bold bet, like buying Tumblr, wait…that already happened. Anyway, you get the point.
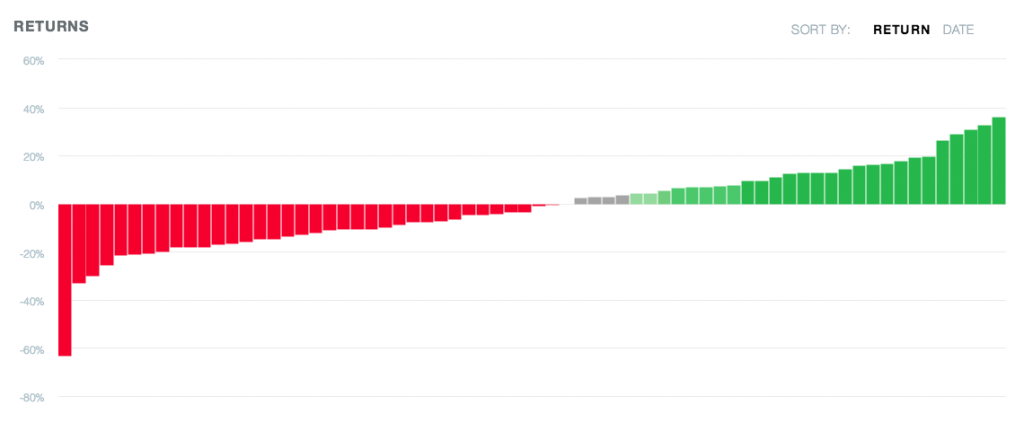
Putting numbers to the many paths forward, we present the short (5 day), medium (3 month) and long (1 year) term views, based on similar conditions in the past, in the six charts below. Take a look at the average returns for each time frame: 1.4% up in the next 5 days, -1.5% down in the next 3 months, 23.2% up in the next 1 year. Feeling a little non-linear? And don’t overlook the range of returns either, they expand, contract and generally defy any last hope of a stable risk profile.
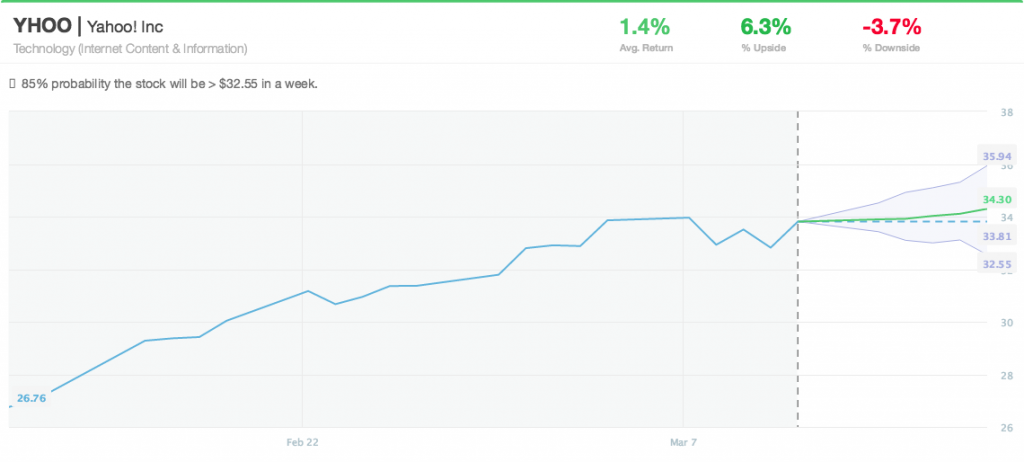
5 Day Forecast (70% probability range of returns)
+1.4% Average
+6.3% Upside
-3.7% Downside
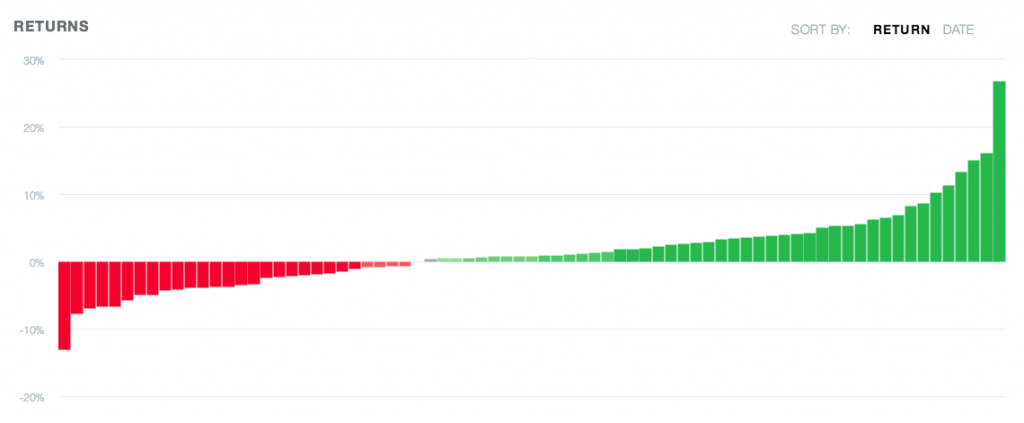
 5 Day Forecast (full conditional distribution)
+26.8% Max Upside
– 13.0% Max Downside
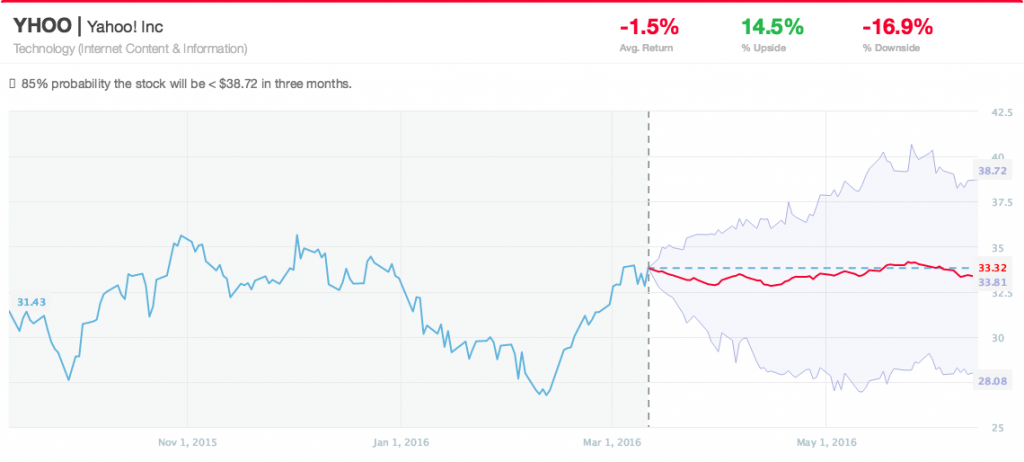
3 Month Forecast (70% probability range of returns)
-1.5% Average
+14.5% Upside
-16.9% Downside
 3 Month Forecast (full conditional distribution)
+36.1% Max Upside
– 63.3% Max Downside
 1 Year Forecast (70% probability range of returns)
+23.2% Average
+96.1% Upside
-36.9% Downside
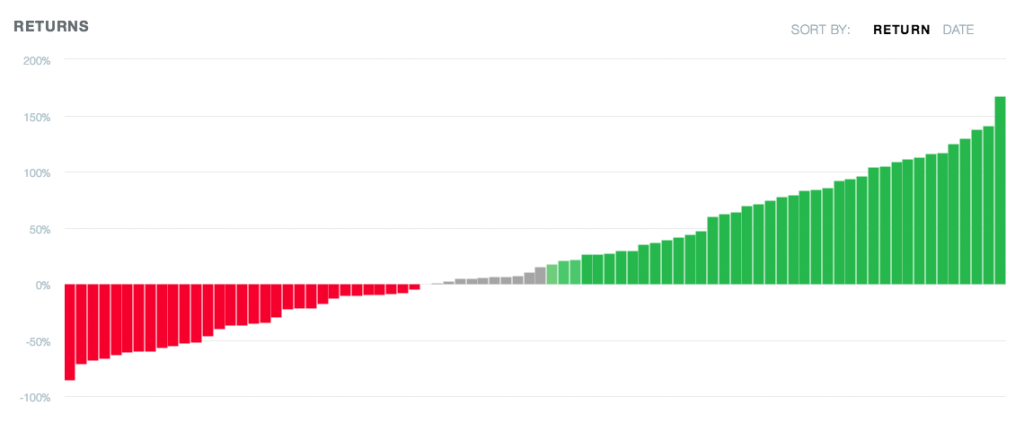
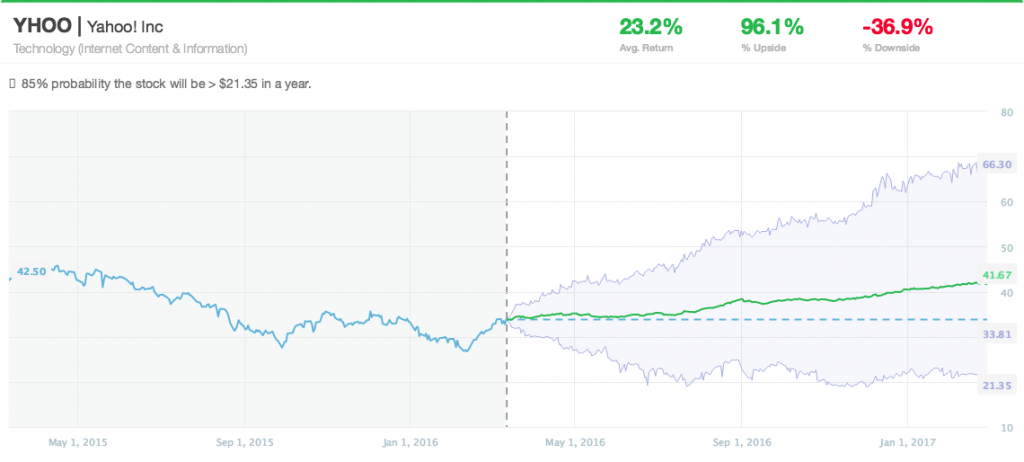 1 Year Forecast (full conditional distribution)
+166.9% Max Upside
– 86.0% Max Downside

