The Tail Ends of the S&P
February 1, 2016"I've experienced the highest of highs and lowest of lows. I think to really appreciate anything you have to be at both ends of the spectrum."
-John Elway
Super Bowl 50 is the Broncos’ eighth trip to the big game, all of those with Elway’s help, first as QB and now as GM. In January 1987, Elway, in a moment known in NFL lore as “The Drive,” led a 98-yard, game-tying touchdown drive against the Cleveland Browns with 37 seconds to spare. Following that game, Elway and the Broncos lost in Super Bowl XXI to the New York Giants. Talk about extreme highs and lows.
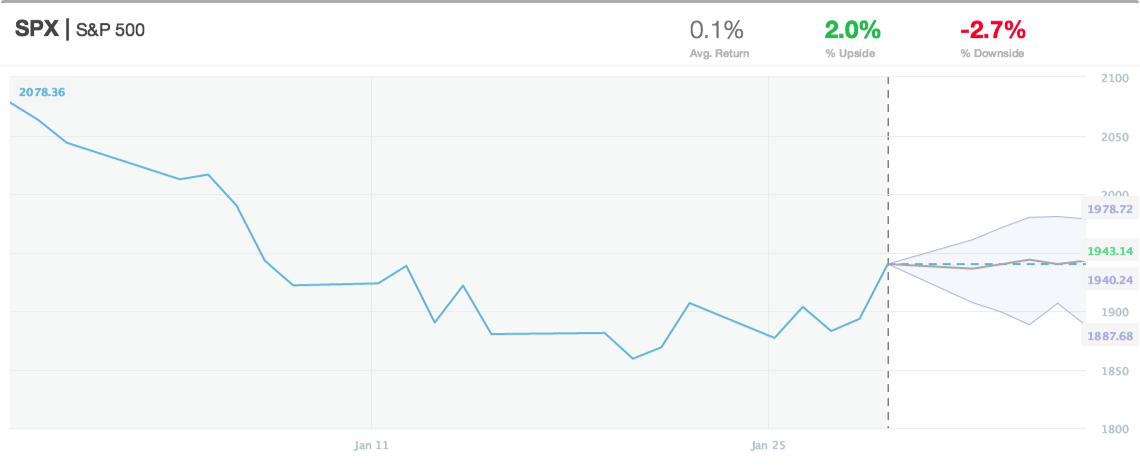
This week, we’d like to spend some time discussing the extreme tails of the S&P. While we typically focus our analysis on the projected average return and the probable range around it (e.g., the 5-day projected cone in the chart below), occasionally it helps to look beneath the aggregate statistics to study the improbable ends of the spectrum.
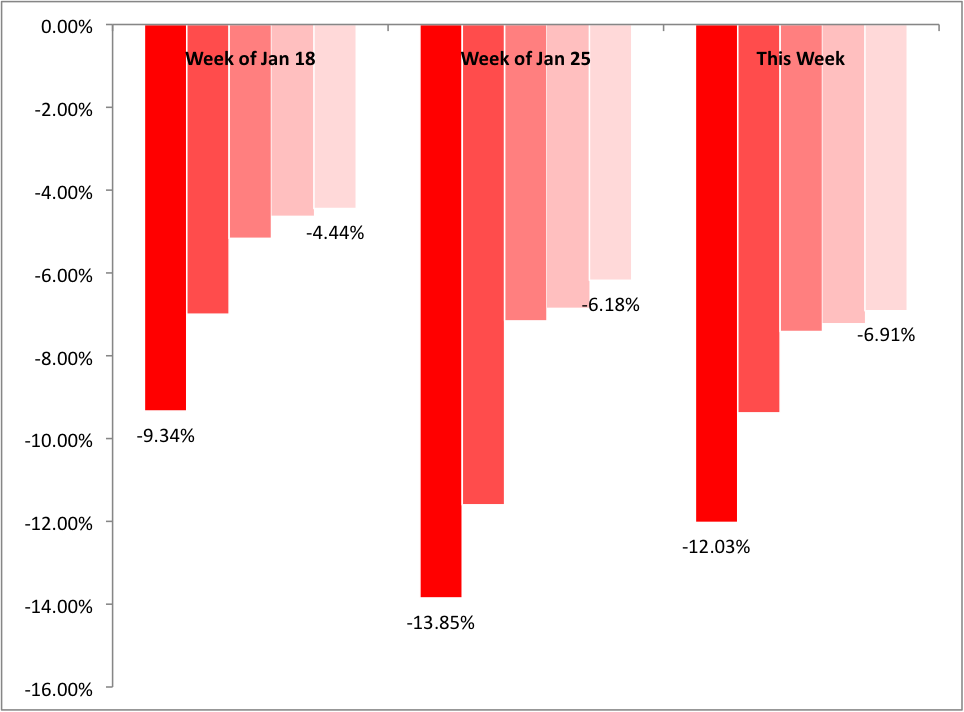
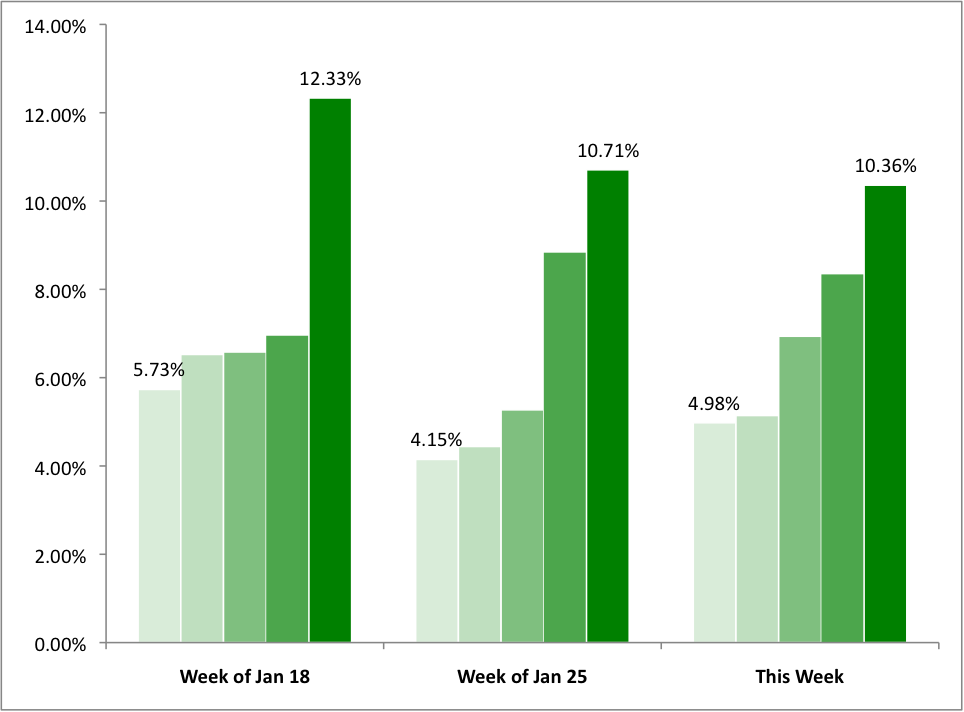
 Below we look at the 5% and 1% probability occurrences for the next 5 days in the S&P, and how these projected tails have evolved over the last few weeks.
Downside Tail: Based on similar historical conditions, the chart below shows the extreme downside possibilities this week at the 5% and 1% probability levels, which range from down -6.91% to -12.03% (the 5 bars to the far right of the chart). For comparison, we also show the five most negative outcomes in the S&P that could have occurred during the week of Jan 18th and 25th.
Upside Tail: Based on similar historical conditions, the chart below shows the extreme upside possibilities this week at the 5% and 1% probability levels, which ranges from up 4.98% to 10.36% (the 5 bars to the far right of the chart). For comparison, we also show the five most positive outcomes in the S&P that could have occurred during the week of Jan 18th and 25th.
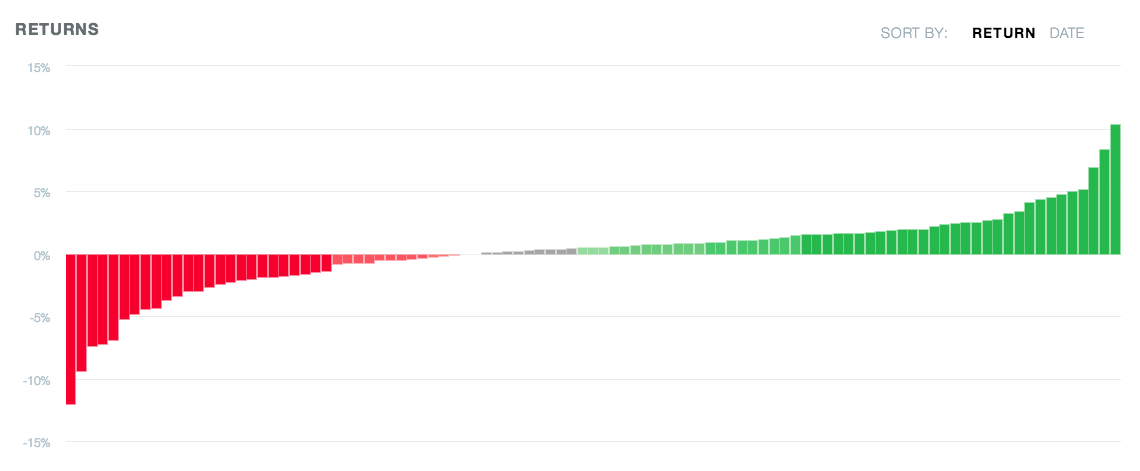
Where do we get these statistics? From the conditional return distribution we generate on the S&P (and all other traded securities) each day. This week, we selected the top and bottom 5 returns from the full distribution presented below.
Traditional models do not reflect the shape-shifting nature of risk. Using a search-by-example approach we create an empirical distribution applicable to today’s conditions. This approach is superior to standard risk measures such as VAR because we are not tied to a particular static model. Given changing conditions in the S&P, we have seen an evolution in tail risk. And as new data comes in, EidoSearch forecasts will continue to evolve.
The picks are coming for Super Bowl 50, and most experts are predicting the Carolina Panthers to win their first Lombardi Trophy. With Elway at the helm, I’d pay attention to the tails.
Have a great week.


